- Platform
- Installing the IONIX Security Splunk app
- Creating an HTTP Event Collector (HEC) token
- Configuring the integration in the IONIX portal
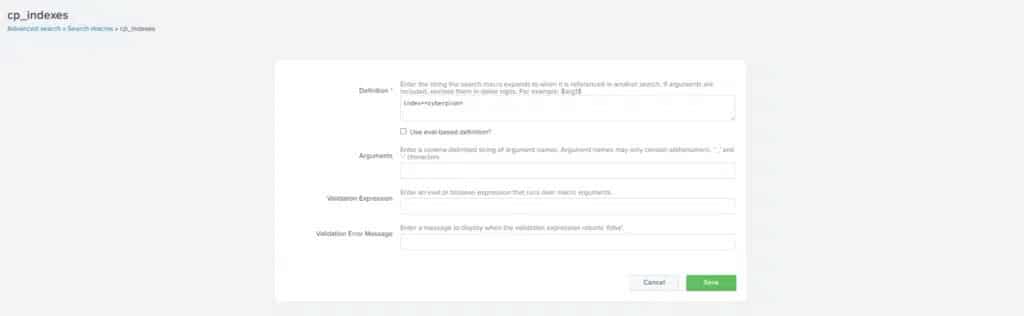
- The format should be: index=your_ionix_index
- Make sure the index you choose exists!
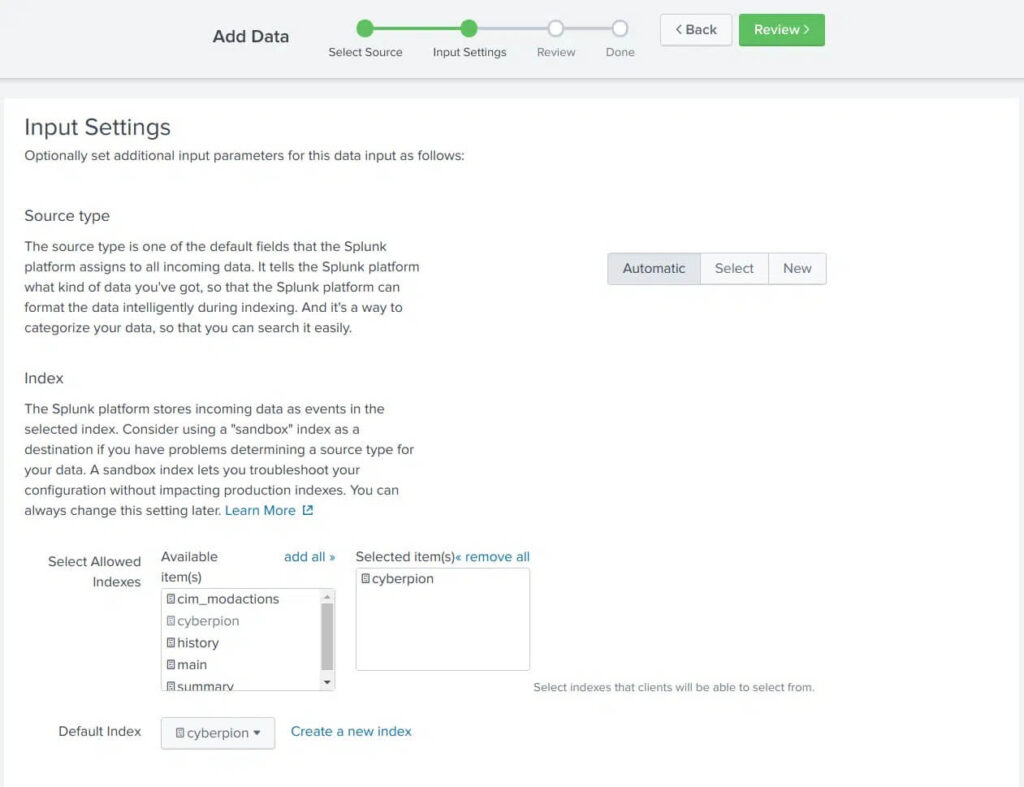
- Set the Source type to Automatic
- Set the index to the one you defined above in “Configuring the IONIX Security Splunk app“
- HEC Token: fa13e094-aa43-4e60-ac95-da8ac5ea7cbd
- plunk Server: https://mysplunkinstance.com:8088/
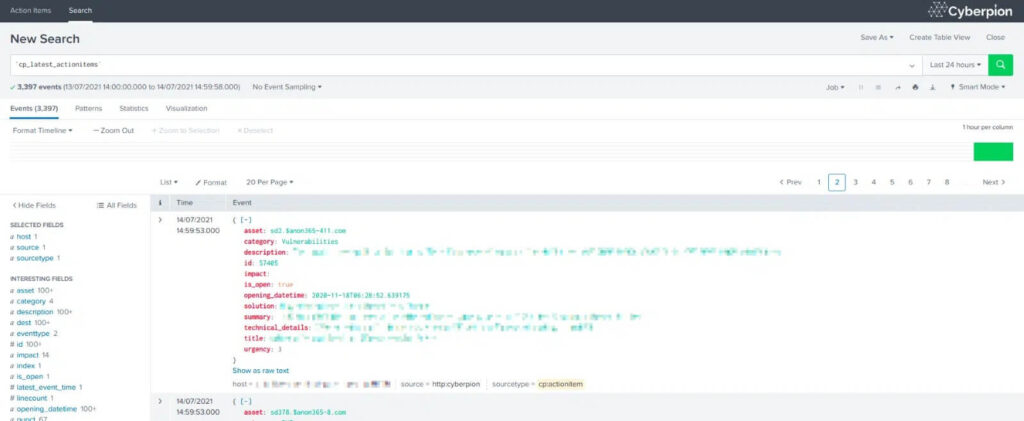
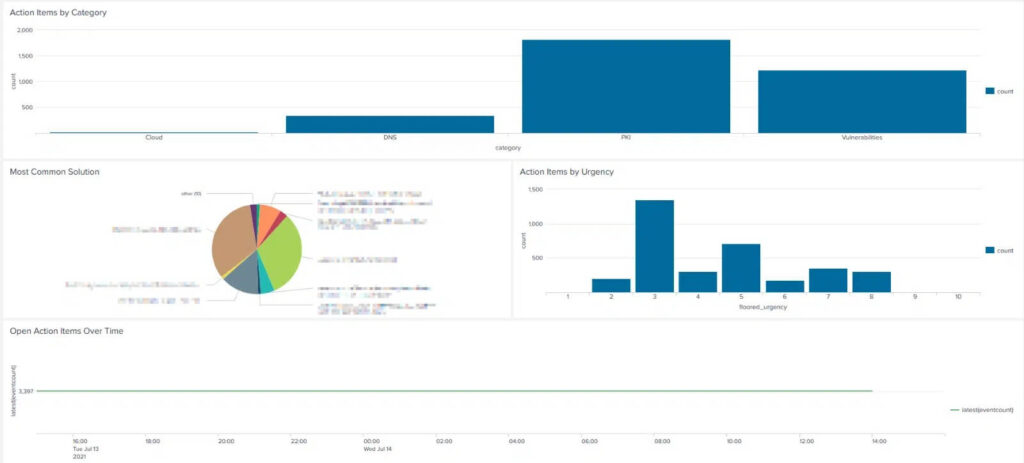
- Try navigating to the IONIX Action Items dashboard and exploring the different macros (cp_latest_* can be pretty helpful!)
Splunk Integration
This article describes how to set up and use IONIXs Splunk integration. You can configure your IONIX data stream to Splunk to have unified visibility over your activities.
This article describes how to set up and use IONIXs Splunk integration. You can configure your IONIX data stream to Splunk to have unified visibility over your activities.
Installing the IONIX Security Splunk app (Enterprise or Cloud)
The IONIX Security Splunk app performs indexed extractions on events, as well as includes visualizations and search macros. For this reason, it should be installed on both the forwarder and the search head (if they are separate).
There are two ways to install the IONIX Security Splunk app:
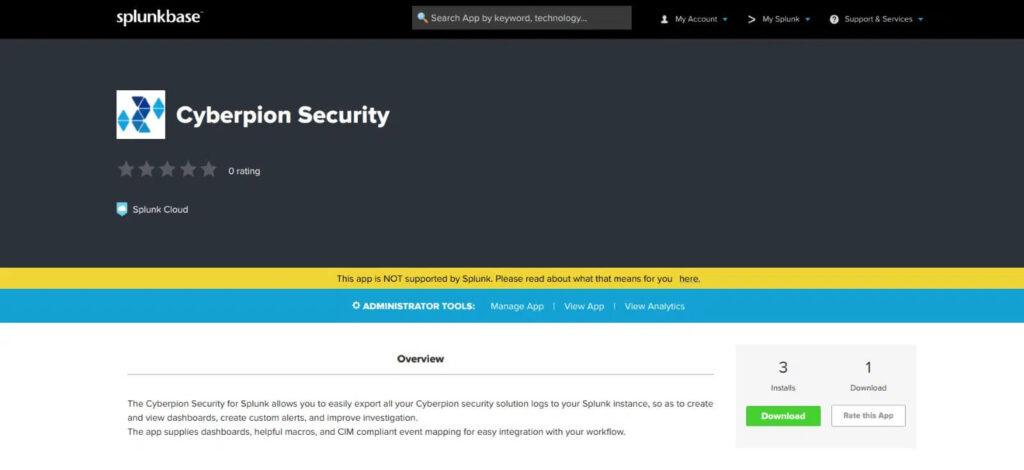
From Splunkbase
1. Open the app page on Splunkbase by searching for “IONIX Security”, or opening this link – https://splunkbase.splunk.com/app/5642/
2. Download the app.

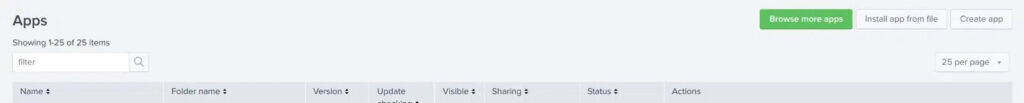
3. Open your Splunk instance’s web interface and navigate to the Manage Apps page.

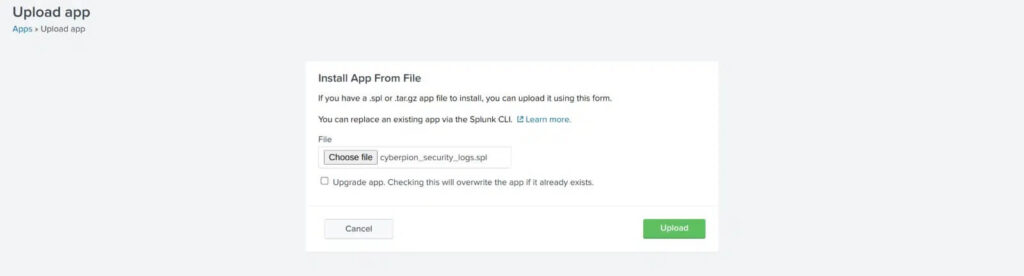
4. Click Install app from file on the top right.

5. Drag the app file to Splunk and hit Upload.

6. Restart your Splunk instance.
From Splunk Web
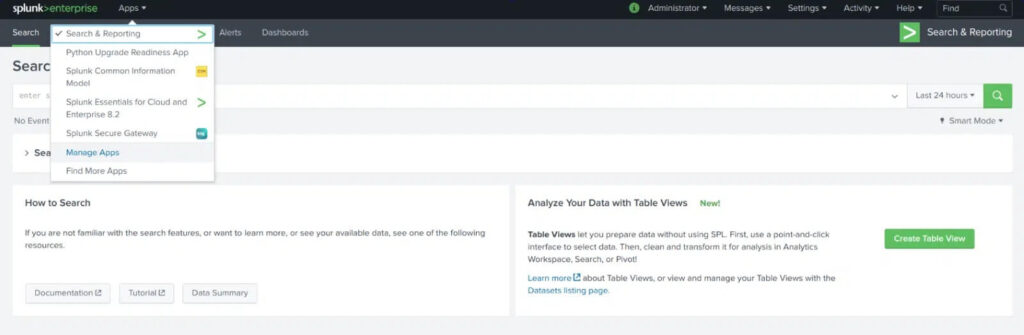
1. Navigate to the Browse More Apps pane in your Splunk instance’s web interface. This can be reached from the home screen or anywhere in Splunk web by clicking the Find More Apps tab as shown here.
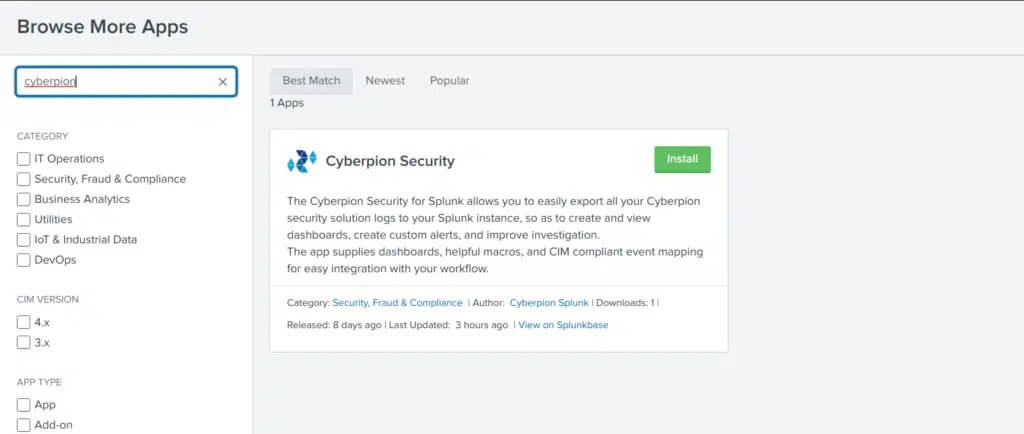
2. Search for “IONIX” and install the IONIX Security app.

3. Restart your Splunk instance.
Configuring the IONIX Security Splunk app
Setting up your IONIX index
1. Go to Settings -> Advanced Search -> Macros
2. Search for cp_indexes
3. Define the index/es that will contain IONIX’s data (this is used by all predefined Macros and Dashboards to query IONIX’s logs.)

Configuring the integration in the Portal
The IONIX integration uses an HTTP Event Collector (HEC) to push data to your Splunk instance.
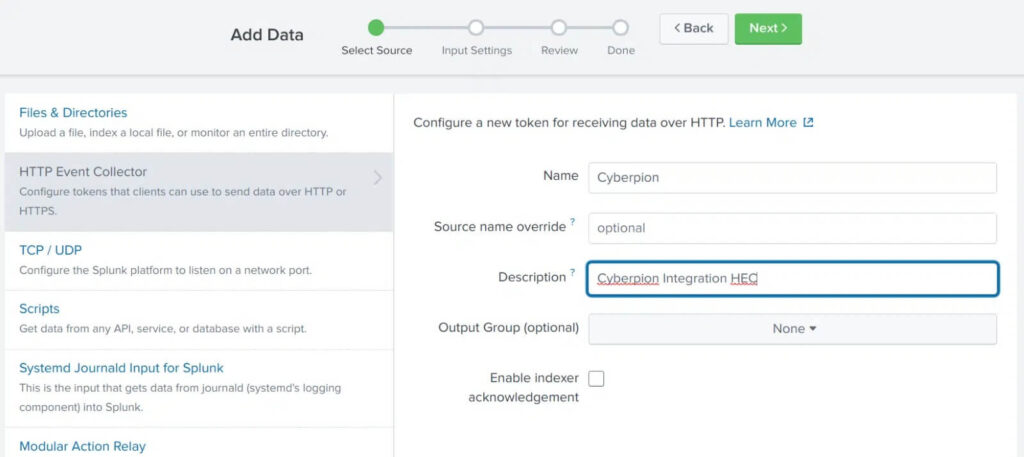
Creating an HTTP Event Collector (HEC)
1. Navigate to Settings -> Data Inputs -> HTTP Event Collector
2. Click Global Settings and ensure that All Tokens is set to Enabled
3. Click New Token on the top right and fill out the forms.

4. Under Input Settings make sure to

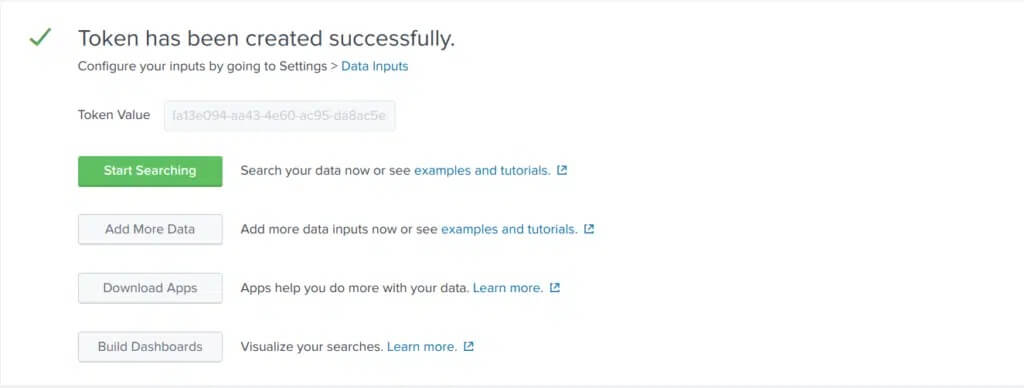
5. After submitting, make note of the created HEC token.
Setting up the integration in the IONIX Portal
1. In your Portal, navigate to Settings -> Integrations
2. Click the Splunk Integration -> Settings
3. Fill out the HEC Token and Splunk Server with the HEC port. For example:
4. Fill out the rest of the data important to you (push interval, etc.)
5. Hit Save.
6. Turn on your integration.
7. Congratulations! You should soon be able to see IONIX’s events in Splunk.

8. It may take up to one hour for data to appear in the account. Once there, data will also be available via the search tab.

9. Finally, head over to the dashboard view to see an aggregated view of the information